Investigate the blktrace implementation to understand the trace hook of the blk IO stack?
blktrace to parse the block io
blktrace explores the Linux kernel tracepoint infrastructure to track requests in-flight through the block I/O stack. It traces everything that goes through to block devices, while observing timing information.
First we using dd command to make a write IO (the read IO is the same).
1
2
3
4
5
// write to a file with direct io by dd command # ddif=/dev/zero of=testfile bs=16k count=1024000 oflag=direct 1024000+0 records in 1024000+0 records out 16777216000 bytes (17 GB, 16 GiB) copied, 111.433 s, 151 MB/s
The following table shows the various actions which may be
       output:

       A      IO was remapped to a different device

       B      IO bounced

       C      IO completion

       D      IO issued to driver

       F      IO front merged with request on queue

       G      Get request

       I      IO inserted onto request queue

       M      IO back merged with request on queue

       P      Plug request

       Q      IO handled by request queue code

       S      Sleep request

       T      Unplug due to timeout

       U      Unplug request

       X      Split
The result is long and there only paste few of them. I try to trace an different sectors and behaviors of block layer.
blkparse command still hard to know the total metrics and statistics, so we can use btt to see the statistic of whole table and picture, this is the part of results:
Q------->G------------>I--------->M------------------->D----------------------------->C
|-Q time-|-Insert time-|
|--------- merge time ------------|-merge with other IO|
|----------------scheduler time time-------------------|---driver,adapter,storagetime--|

|----------------------- await time in iostat output ----------------------------------|
Q2Q — time between requests sent to the block layer
Q2G — time from a block I/O is queued to the time it gets a request allocated for it
G2I — time from a request is allocated to the time it is inserted into the device’s queue
Q2M — time from a block I/O is queued to the time it gets merged with an existing request
I2D — time from a request is inserted into the device’s queue to the time it is actually issued to the device (time the I/O is “idle” on the request queue)
M2D — time from a block I/O is merged with an exiting request until the request is issued to the device
D2C — service time of the request by the device (time the I/O is “active” in the driver and on the device)
Q2C — total time spent in the block layer for a request
Actually the blktrace’s implement is using various linux kernel tracepoint to trace different phase of IO. Here are some of the key tracepoints used by blktrace:
block_rq_insert: This tracepoint is hit when a request is inserted into the request queue.(Q)
block_rq_issue: This tracepoint is hit when a request is issued to the device.(I)
block_rq_complete: This tracepoint is hit when a request is completed.(C)
block_bio_queue: This tracepoint is hit when a bio is queued.(Q)
block_bio_backmerge: This tracepoint is hit when a bio is being merged with the last bio in the request.
block_bio_frontmerge: This tracepoint is hit when a bio is being merged with the first bio in the request.
block_bio_bounce: This tracepoint is hit when a bio is bounced.
block_getrq: This tracepoint is hit when get_request() is called to allocate a request.
block_sleeprq: This tracepoint is hit when a process is going to sleep waiting for a request to be available.
block_plug: This tracepoint is hit when a plug is inserted into the request queue.
block_unplug: This tracepoint is hit when a plug is removed from the request queue.
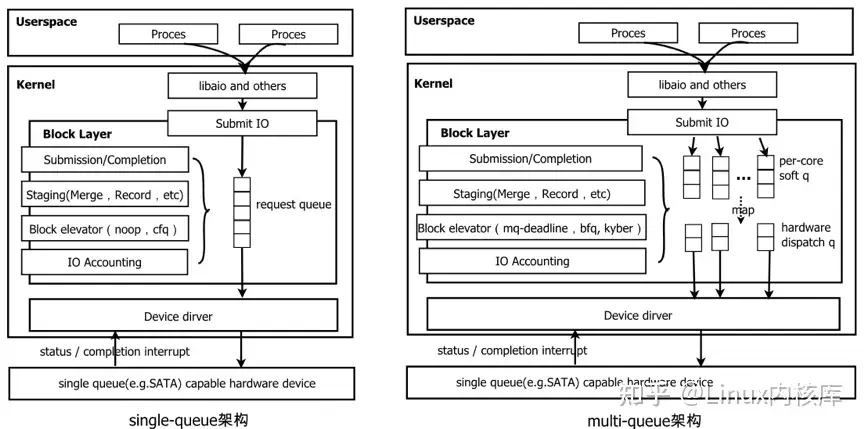
Main data structure in block layer
To deepdiv the block layer, i read the code and finding as followes:
/* * main unit of I/O for the block layer and lower layers (ie drivers and * stacking drivers) */ structbio { structbio *bi_next;/* request queue link */ structblock_device *bi_bdev; unsignedlong bi_rw; /* read or write */ ... structbio_vec *bi_io_vec;/* the actual vec list */ structbvec_iterbi_iter;
};
/** * struct bio_vec - a contiguous range of physical memory addresses * @bv_page: First page associated with the address range. * @bv_len: Number of bytes in the address range. * @bv_offset: Start of the address range relative to the start of @bv_page. * * The following holds for a bvec if n * PAGE_SIZE < bv_offset + bv_len: * * nth_page(@bv_page, n) == @bv_page + n * * This holds because page_is_mergeable() checks the above property. */ structbio_vec { structpage *bv_page; unsignedint bv_len; unsignedint bv_offset; };
/* * Try to put the fields that are referenced together in the same cacheline. * * If you modify this structure, make sure to update blk_rq_init() and * especially blk_mq_rq_ctx_init() to take care of the added fields. */ structrequest { structrequest_queue *q; structbio *bio; structbio *biotail; union { structlist_headqueuelist; structrequest *rq_next; }; enummq_rq_statestate; /* * The hash is used inside the scheduler, and killed once the * request reaches the dispatch list. The ipi_list is only used * to queue the request for softirq completion, which is long * after the request has been unhashed (and even removed from * the dispatch list). */ union { structhlist_nodehash;/* merge hash */ structllist_nodeipi_list; };
/* * The rb_node is only used inside the io scheduler, requests * are pruned when moved to the dispatch queue. So let the * completion_data share space with the rb_node. */ union { structrb_noderb_node;/* sort/lookup */ structbio_vecspecial_vec; void *completion_data; }; /* * completion callback. */ rq_end_io_fn *end_io; }
/** * struct blk_mq_hw_ctx - State for a hardware queue facing the hardware * block device */ structblk_mq_hw_ctx { /** * @queue: Pointer to the request queue that owns this hardware context. */ structrequest_queue *queue; /** * @dispatch_busy: Number used by blk_mq_update_dispatch_busy() to * decide if the hw_queue is busy using Exponential Weighted Moving * Average algorithm. */ unsignedint dispatch_busy; }
code flow in block layer
Bio -> Request -> plug request list -> staging request queue in sheduler -> hardware request queue


These pictures records the total main code and function flow from the filessystem to block layer and to driver layder. It also prints the tracepoint mapping to the acation in output of the blktrace where they trace from. By these tracepoint, we can understand the block io process flow more clearly.